Manufacturing processes can, on the surface, appear to be an amorphous web of convoluted conveyors and machinating machinery. But taking a closer look through the eyes of a quality engineer reveals that the process that leads to reliable products is, in fact, itself a series of decisions, each compounding, and building on every preceding action.
Breaking down the interrelated processes within a production system is crucial to isolating issues, getting to the root cause, and efficiently implementing solutions.
Our manufacturing processes are getting smarter. To keep up, manufacturers need to gird their production lines with intelligent sensors and monitoring equipment that will allow them to make each of those interdependent decisions based on critical data. Informed decisions enable engineers to coordinate a process that ultimately has zero defects and outputs products that have no risk of recall or warranty claims.
In order to actualize an Industry 4.0 dream level of efficiency and productivity, manufacturers need to assess their current processes. They need to recognize their production gaps and the places they don’t have visibility and then install quantitative measures to generate actionable data.
Read on to learn more about where those gaps can easily exist in manufacturing processes in any industry and the good news for manufacturers who intend to do something about it.
The Most Common Mistake in Solving Adhesion Problems in Manufacturing
Here are some collected statements from Brighton Science customers during Adhesion Processes Surveys we’ve conducted:
- “We’ve tailored our plasma treatment process based upon what our vendor told us, but we’re still having surface adhesion problems.”
- “We were told that a better, more uniform corona treater for our line would solve the problem, but for some reason, our final product still has not improved.”
- “We’re abrading our material surface before we paint, so that can’t be the problem.”
- “The place where we get our solvent said that this solvent works best for our process.”
Implicit in each of these remarks is a process gap that exists because of a lack of visibility at a particular (and vital) aspect of manufacturing that can make or break each of the described processes.
The vital and overlooked process element is the quality of the bond surface. If the manufacturers had looked to the material surface itself to solve their surface adhesion problems, tens of thousands of dollars and hundreds of production hours could have been saved.
To learn how to conduct your own root cause analysis using contact angle measurements, download our free eBook: Checklist: Adhesion Failure Root-Cause Analysis for Manufacturers
All of these manufacturers were experiencing adhesion problems in their processes. Whether printing, painting, coating, cleaning, sealing, or bonding, they all had instituted some kind of surface preparation, cleaning, or treatment process and conducted these procedures as instructed by the equipment or adhesive vendors. This fact begs the question, why was that not sufficient?
If we add a measurement of surface quality to the equation, we can predict a different outcome in each of the four examples:
- The first manufacturer was under the impression that tuning the plasma treater was the answer to achieving the best surface prep. This is partially true, but without a measurable evaluation of the surface being treated, any tweaking to treatment parameters are merely best guesses. A quantitative measurement that provides an understanding of the material surface itself so adjustments can be made based on the incoming quality of the surface and then prove that the optimal treatment level was reached after plasma was applied.
- The second manufacturer ran into trouble because even the most sophisticated surface treatment and preparation equipment is only as good as the verification process that determines if the surface was properly prepared. With a data-driven inspection before and after corona treatment, this manufacturer could have made precise and reasoned adjustments to their treater and got the results they desired.
- The third manufacturer is reliant upon a “we’ve always done it this way” ethos, much to their detriment. Abrasion on its own is not a guarantee of successful adhesion. There are many variables that can change as materials evolve and vendors shift. All of these variables need to be considered as they can have a profound effect on surface quality. For instance, the sandpaper used in this scenario had a stearate on its surface, which was transferred to the metal they were abrading. Although the metal was indeed sanded, it was not ready to chemically bond to the adhesive that was being applied to it. There were 1-2 molecular layers of stearate residue that prevented adhesion from occurring.
- For the fourth manufacturer, they assumed taking the word of a vendor is enough to guarantee proper adhesion and a successful operation. Sadly, without proper surface-sensitive inspections, the advice from solvent, paint, or adhesive vendors will only go so far. While this is not the fault of the manufacturer, it’s a common occurrence. This example resulted in needing to find a stronger solvent that could properly remove contaminants that the manufacturer didn’t know were present until they measured the surface quality and realized the solvent their vendor suggested wasn’t actually removing every contaminant.
Adhesion Process Root Cause Analysis - What Manufacturers are Missing.
Manufacturers who paint, print, bond, coat, or seal have been left in the dark when searching for answers to solving their adhesion problems.
But there's a light at the end of the tunnel.
To illustrate the dilemma manufacturers routinely face, let’s examine one manufacturer’s struggle to solve peeling paint in their operation. The main objective was to solve a common manufacturing problem with a not-so-common solution.
Process Objective: Eliminate peeling paint that’s resulting in considerable rework and lost production time.
What approaches were taken by the manufacturer to solve the problem?
- Changing the type of paint being used on the material
- Changing the type of sandpaper being used
- Applying another layer of paint to the surface
- Adding a solvent wipe after abrasion
All of these responses to adhesion failure seem reasonable on their face as they are the customary solutions to these sorts of problems. But, there’s a distinct error hiding behind these solutions.
Nothing empirical can be decided until the material surface being treated is itself fully understood.
Making changes to the process itself without using quantitative, real-time data that elucidate how your processes are actually affecting the material surface means you will have no way to predict the outcomes of your process. Manufacturers making adjustments to surface critical processes without measuring the impact won’t know if their changes were meaningful until they do performance testing way downstream. By that point, it will be incredibly difficult to conduct useful root cause analysis to pinpoint the upstream step that wasn’t meeting the requirements.
Measuring surface quality at every Critical Control Point, or any place in the manufacturing process where the surface has an opportunity to change in any way whatsoever, is the only way to collect data for precise root cause analysis.
Predictive analytics that indicates with certainty that a cleaning, treatment, or preparation process is creating bondable surfaces within the tolerances of the performance standards is the only way to guarantee reliability.
The 4 Most Common Ineffective Methods of Surface Quality Measurement
The search for a reliable, repeatable, objective method for measuring surface readiness for adhesion and cleaning processes has been a source of immense consternation for manufacturers. The methods most commonly used leave much to be desired as they do not provide ample information about the effectiveness of surface preparation, cleaning, and treatment processes.
As was outlined above, the difference between a process that consistently produces average products as opposed to completely reliable, industry-leading products is a process that has an appropriate, optimized, and monitored surface preparation process.
The only way to truly know if a given adhesion process is on one side of that spectrum or the other is whether or not it considers the impact its procedures have on the top 3 molecular layers of the material surface being worked on.
So, since achieving predictable adhesion is dependent on such a thin and delicate layer of the material surface, it follows that the need for a highly sensitive, accurate, objective, and Materials Science-based measuring system is the order of the day.
Let’s take a look at the most commonly employed methods of surface evaluation to see if they measure up.
1. Water Break Testing: “Spray and Pray”
Method: Commonly the standard in the aerospace & automotive industry, this method involves spraying a surface with water and observing the behavior of the water as it runs off the material.
Drawbacks: Subjective, qualitative evaluation of water. Essentially a “quick and very-dirty” method of evaluating cleanliness. Offers no quantitative value and no information concerning how close the part is to failure. This method is possible to do in-line but is most often done in a secluded area since it’s rather messy.
2. Dyne Pens: “Close Enough”
Method: Commonly the standard in the film & flexible packaging industry, this method involves placing a stripe of hazardous, colored ink onto the surface to visually observe how the ink wets out or beads up on the surface.
Drawbacks: Subjective evaluation of a destructive ink. Often gives false positives since the ink includes a solvent that can cut through contamination on the surface and will react as though the contamination is not there. Dyne ink behavior is difficult to assess consistently, and often the interpretation of how it reacts to the surface can change depending on who is implementing the test.
3. Benchtop Contact Angle Goniometer: “Two-Point Measuring Lab Tool”
Method: Commonly used in labs for obtaining water contact angle measurements. This method measures two points of contact of a water drop resting on a surface by taking a side-long look at how much the drop wets out or beads up on the surface.
Drawbacks: Not as accurate or reliable as a top-down measurement that can take 64 simultaneous measurements of a deposited drop. Traditional goniometers can potentially offer misleading data due to undefined edge lines at low contact angles. Moreover, these instruments are not viable for mobile or real-time production testing.
4. No-Method at All: “Out of Control Processes”
Method: Through no fault of their own, some manufacturers still have not been able to find and/or implement a reliable, repeatable, practical, and objective way to measure surface quality and therefore have little more than a visual “does it appear clean?” test before sending parts downstream where hopefully strength and performance tests will catch any problems.
Drawbacks: Manufacturing processes are inherent “out of control” due to a lack of monitoring processes that accurately keep an eye on variables that impact surface quality and adhesion success. Final product quality is completely left up to chance, with no way to measurably reduce scrap, predict performance or build new processes that are at low risk of failure.
Good News for Process and Quality Engineers
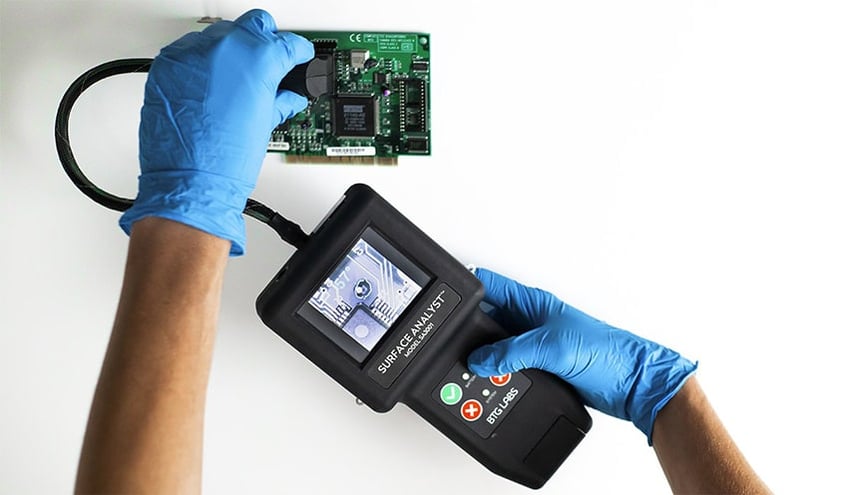
There is a method of surface quality measurement that actually provides a numerical evaluation of exactly what matters to the success of adhesion problems. Moreover, it can be implemented directly on the production line, near the action, to serve up data derived from looking at real parts in real time.
A simple contact angle measurement deployed through an automated or handheld surface energy measurement system is the most accurate and rapid way to mine your process for predictive analytics to put your products on the right course.
These measurements are conducted by depositing a tiny drop of liquid on a surface and measuring the angle the drop makes with the surface. If the angle is high (i.e. >~70 degrees, depending on the material and application), this indicates that the surface is not very reactive as the liquid is repelled by it as opposed to being attracted to it. If the liquid wets out and creates a low angle (i.e., <~50 degrees, depending on the material and application), then this indicates a reactive surface that is ready for adhesion.
When contact angle measurements are taken with devices that are built for the factory floor so that series of inspections can happen in mere seconds, and results can easily be tracked to show quality trends, then manufacturers have a whole new level of visibility into their process.
Smart sensors that prove the effectiveness of cleaning and treatment steps while also providing crucial information about the baseline quality of surfaces as they enter a facility or a process put manufacturers at an unprecedented advantage. Cleaning equipment and treatment systems can be optimized to precisely clean surfaces and make sure they are, without a doubt, ready for adhesion.
- Finally, push product development past key sticking points
- Fix long-standing, seemingly unsolvable bond-line failures
- Reduce scrap, rework, and production downtime to all-time lows
Accomplishing these is a reality because, through contact angle measurements, accurate surface energy data can finally be attained while parts are actually going through the production process. Surface energy is a chemical characteristic that refers to how reactive a surface is and, therefore, how strongly it will bond with another substance (e.g., paint, epoxies, UV curing adhesives, inks, molten metal in the case of brazing or soldering, etc.).
All of the traditional methods attempt to evaluate surface energy as it is the most precise predictor of adhesion success or failure. All of them fall short, however, due to limitations in giving useful data (if any at all) that accurately correlates to surface energy and the inability to be implemented where it’s most necessary, on the factory floor.
Let’s illustrate the way that accurate surface quality measurements can subvert expectations by revealing insufficiencies in cleaning and treatment that less sensitive methods habitually miss:
The Process: Solvent Wiping and Abrading Aluminum
- You’ve just solvent-cleaned an aluminum surface.
- Your average inspection number after evaluating a series of washed parts is 56 degrees.
- You know that abrading an aluminum surface helps promote stronger bonds. However, after using sandpaper on the surface, your average measurement has increased to 79 degrees.
- This can be an indication of stearate being transferred to the metal surface.
The Process: Flame Treatment of Polymers
- You’re analyzing thermoplastic parts before and after flame treatment.
- The pre-treated surfaces show an average measurement of 81 degrees.
- You know that flame treatment is a common and useful preparation of polymers for printing, so you expect the number to decrease. However, after flame treatment, the number is 92 degrees.
- This could be an indication of some kind of plasticizer additive within the bulk of the material migrating to the surface and interfering with the adhesion.
The Process: Hand-Prepping Peel-Ply Composites
- You’re prepping a peel-ply composite surface in an ultra-clean room for adhesive bonding.
- You’ve determined that your freshly peeled composite surface yields an average number of 36 degrees.
- The peeled composite is left out overnight, totaling 10 hours of exposure time. When you come back in the morning to check the surface before bonding, the average number of the composite is 58 degrees.
- Surfaces that are otherwise clean and ready for adhesion will degrade over time and need to be stored in a manner that mitigates this degradation if the adhesion step cannot take place immediately after preparation.
The link between these examples is that the quantitative surface quality inspections exposed unforeseen inadequacies with common preparation and treatment methods. If additional inspections are conducted throughout the manufacturing process of the material surfaces discussed above, then finding the root cause of the anomalous number of changes is possible. It all comes down to measuring surface quality at every point in the process, which could potentially alter the quality.
To learn how to conduct your own root cause analysis using contact angle measurements, download our free guide on how you can get started today. In our eBook “Checklist: Adhesion Failure Root-Cause Analysis for Manufacturers,” you’ll receive step-by-step guidance on how to take a closer look at your process and ensure it is free from the most common quality gaps.