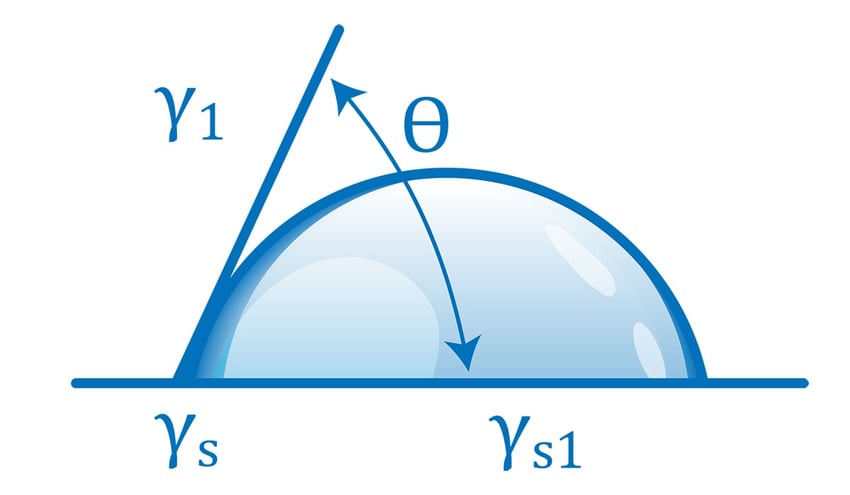
Determining whether your material surface has been adequately cleaned or prepared for bonding, coating, sealing, painting, or printing requires the ability to objectively quantify the chemical and physical characteristics of the top few molecular layers: this is where all the action is. Water contact angle (WCA) measurements are sensitive indicators of whether a product’s surface has been properly prepared. As with any measurement, there will be point-to-point variability in WCA measurements. This variability is not random and contains important information about the surface. It is necessary to understand the sources of this variability when making decisions regarding whether your product surface should be accepted as in-spec or rejected as out-of-spec.
3 Sources of Measurement Variability
A sensitive measurement tool will always show some variability from measurement to measurement. This variability results from a combination of factors; we’ll touch on all of them.
The first two sources of variability are the reproducibility and repeatability of the tool itself, which are distinct properties of a measurement device.
Repeatability refers to the consistency of repeated measurements on the same object, or identical objects, using the exact same method each time: for example, if you repeatedly measure the mass of a small piece of aluminum foil on a scientific balance, the mass will vary slightly from measurement to measurement, typically in the last decimal place. The mass of the foil is not going up and down! This measurement-to-measurement drift comes from external factors (random air currents, for example) along with the variability inherent in the instrument itself.
Reproducibility refers to the effect that an operator can have on the outcome of the measurement. Using our mass measurement as an example, if one operator drops the foil onto the balance from a height of two inches and reads the mass before the balance has settled down, this person will obtain consistently different results from an operator who gently places the foil on the balance pan and allows the display to equilibrate before taking a measurement.
The reproducibility and repeatability of some kinds of measurement devices can be quantified by a formal protocol called Gage R&R, which typically involves having two or more operators measure a series of identical samples to determine the inherent variability in the tool and the variability due to operator effects.
There is a third source of variability, which is the one we are trying to get at when we make measurements: it is the variability due to the properties of interest of the materials and the effects of any processes on these properties.
Material properties that are determined by surface chemical composition are very delicate and, therefore, variable from object to object as well as from point to point on the same object. If this is not appreciated and taken into account when evaluating contact angle measurements, it can become a source of confusion. When it is appreciated, it contributes a whole new dimension to the control of surface properties as well as process improvement and product quality control.
How to Put a Number on Measurement Variability
There are several ways that variability can be measured, and the most common way is to take multiple measurements and determine the mean and the standard deviation of the data. When discussing data that is normally distributed (like contact angle data), the mean is the most likely value of any individual measurement. The standard deviation can be thought of as a measure of the average amount that an individual measurement will differ from the mean. For example, if a set of measurements has a mean and standard deviation of 26 ±3, it means that most measurements (actually 68.2%) will fall between 23 and 29. Fewer measurements will fall outside of this range, and the precise amount can be read directly from the Figure: for example, 2.1% of all measurements will fall between 2 and 3 standard deviations higher than the mean.
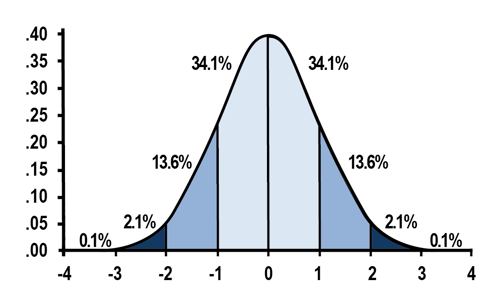 This Figure shows a standard normal distribution; the numbers on the X-axis represent the number of standard deviations an individual measurement is away from the mean, and the zero point on the horizontal axis represents the mean contact angle. The area under the distribution is the probability of measuring a contact angle between any two values. For example, the probability that an individual contact angle measured on this surface will fall within -1 and +1 standard deviations of this mean is 34.1+34.1=68.2%. As an example, if it’s determined that the surfaces in production when everything is working correctly have a mean contact angle of 35° ±3°, then 68.2% of all the measurements will fall between 32° and 38°. Furthermore, 13.6% of individual measurements will fall between 29° and 32° (1 to 2 standard deviations below the mean), and 13.6% will fall between 38° and 41° (1 to 2 standard deviations above the mean). Many processes are considered ‘in spec’ if they return average contact angle values that are within ±2 standard deviations of the mean. However, the sensitivity of the desired product performance parameters (e.g., bond strength, cross-hatch tape peel adhesion, etc.) to the contact angle needs to be evaluated for each process to set the acceptable range with confidence.
Variability in Contact Angle Measurements
Contact angle goniometry[1] has several inherent sources of variability. The first ones we’ll discuss have to do with the measurement technique. It is minimized by using the right kind of equipment and the right techniques to measure contact angle. After that, we will cover the ones related to process control. Quantitative sensing of this variability is the goal of contact angle measurements in manufacturing.
One source of variability is the technique used to place the drop of liquid on the surface. There is not one contact angle for a given liquid/solid pair, but rather a range of stable contact angles that can be established. The largest possible angle, the advancing angle, is established as the liquid slowly advances over the surface, for instance, by slowly increasing the volume of a growing drop from a syringe needle or by slowly immersing a film sample into a beaker of liquid when using a Wilhelmy balance. The lowest angle is established as the liquid is slowly withdrawn from the surface and is called the receding angle. The difference between the advancing and receding angle is called the contact angle hysteresis.
There are other stable contact angles between the extremes of the advancing and the receding angles as well. Gentle placement of a liquid drop tends to establish an advancing angle; less delicate transfer of the liquid to the surface establishes a lower angle that is closer to a receding angle. The magnitude of the variability from this source depends on the amount of contact angle hysteresis and can vary from a degree up to even 15° or 20°. The reproducibility of the deposition process is a source of variability that is critical to control. An automated liquid deposition is an important feature of contact angle measurement equipment to minimize variability from this source.
Another source of variability is the precision with which the goniometer measures the actual angle. Most modern side-view goniometers use image analysis to fit a segment of a circle to a profile view of the drop and may depend on the operator to define the location of the horizon. The error in the measured angle and the actual angle obtained by careful operators is generally accepted to be with 1° or 2°, which is sufficient precision to sense changes in surface properties.
Another source of variability in contact angle measurements using side view goniometers on real-world (i.e., imperfect) surfaces is drop asymmetry. Because of point-to-point variation on the millimeter scale in chemical composition, surface texture, and occasional dust particles, liquid drops deposited onto typical surfaces encountered in manufacturing are rarely perfectly round. As a result, there is a range of contact angles around the drop perimeter. Side-view goniometers miss this nonuniformity in the drop shape because they only measure two diametrically opposed points around the perimeter of a drop. The contact angle value measured using a side-view goniometer can easily be several degrees different than the true average contact angle. Top-down view goniometers (which use drop area and volume to calculate contact angle) return a number that is a robust measure of the true average contact angle of the entire drop perimeter. Furthermore, there is a whole new dimension of information about surface uniformity and texture available by analyzing the drop roundness.
The final and probably most important source of variability in contact angle measurements is due to process variability. This typically occurs at a size scale greater than the size of the liquid drop: many millimeters to centimeters or meters. The ability of contact angle methods to sense this variability is one of the greatest advantages of the technique but also one of the greatest sources of confusion when process and quality engineers begin to use contact angle methods instead of traditional methods like dyne pens or dyne inks to sense surface properties. (For an in-depth discussion and comparison of dyne solutions and contact angle methods, see the white paper “A Comparison of Dyne Inks with the Surface Analyst™” ).
When measuring carefully prepared surfaces with stable high-quality automated equipment, we can see a total point-to-point variability of about 1° or less. The most consistent industrial surfaces will show a total point-to-point range of maybe 5° or 6°, corresponding to a standard deviation of about 2°. This is the level of variability seen on carefully cleaned surfaces… the word ‘carefully’ is italicized because typical industrial cleaning and treatment processes (e.g., multistage wash processes for machined metal parts) struggle to achieve this level of uniformity. High levels of uniformity are achievable via very well-designed and maintained washers and vapor degreasers, as well as scrupulously performed manual processes. In practice, surfaces subjected to cleaning processes will show standard deviations between point-to-point contact angle measurements around 4° to 5°.
The magnitude of the point-to-point variability is characteristic of the material and process and is well worth monitoring. This is accomplished by taking sufficient measurements from ‘in-spec’ parts to determine the distribution (i.e., the mean and standard deviation). This ideally involves obtaining 50-100 measurements, although as few as 20 may be sufficient.
One important consequence of this variability is the necessity to base decisions regarding surface state on the average of more than one measurement. Typically, 3 to 5 will be sufficient. (For an in-depth discussion of how to determine appropriate sample sizes for making decisions based on contact angle measurements, see the article “How Many Measurements Are Enough? Making Quality Decisions Based on Contact Angle Measurements”.) Once the variability inherent in the measurements and inherent in the surfaces are appreciated, using contact angle data to understand and control processes becomes much more straightforward.
Using Measurement Variability to Understand and Control a Process
Changes in measurement variability (e.g., the standard deviation of multiple measurements) are an important parameter to track as it signals a deterioration in the process or some other change that can affect product performance. For example, the spray nozzles in parts washers are items that wear and lose performance over time. This frequently results in non-uniform cleanliness that is easily detected by an increase in the point-to-point variability of contact angle measurements. Furthermore, the data generally points directly to the underperforming nozzles that require maintenance. Another typical example is in the corona or flame treatment of polymer films. These processes can be quite uniform until an equipment issue results in ‘laning’: a band of over- or under-treated material that extends the length of the film. The uniformity of automotive parts that have been plasma or flame treated depends very heavily on the control of the plasma-to-surface distance and the traverse speed; minor shifts in effector alignment can result in significant changes in treatment level that adversely affects paint and adhesive performance. These shifts show up immediately in contact angle distribution across the part surface.
An under-appreciated source of variability in any cleaning or treatment process is the effect of the surface state prior to the cleaning or treatment process: things like excess or non-uniform mold release, unusually heavy or non-uniformly distributed soils, incorporation of excess regrind in an injection molded part will result in a different material surface that will likely respond differently to the cleaning or treatment process. This points out the importance of incoming material specifications for minimum surface cleanliness that can be effectively and reliably treated via cleaning or treatment processes in production.
Effective and Practical Contact Angle Measurement in Production
Control of surface engineering processes such as parts washing, vapor degreasing, precision cleaning, and surface treatments such as plasma or corona treatment is readily accomplished in many cases via monitoring both average contact angles as well as contact angle variability. The most effective equipment for these tasks combines the characteristics pointed out in this article: rapid, automated liquid delivery to the surface, top-down assessment of drop shape as well as contact angle, and convenient software for incorporating the data into an overall control scheme.
For an in-depth discussion of how to determine appropriate sample sizes for making decisions based on contact angle measurements, see the white paper: “How Many Measurements Are Enough? Making Quality Decisions Based on Contact Angle Measurements.”

[1] Goniometry literally means ‘angle measurement” from the Greek words gōnía (angle) + métron (measure)