The seemingly easy and obvious answer to the question implied in the title of this article is: reliability means no failures whatsoever forever and ever, amen.
Sadly, it’s not quite so simple.
For manufacturing engineers, reliability is an elastic concept that is particular to each and every design.
Generally speaking, reliability is assessed by evaluating how a product must perform to satisfy the needs of the users over the lifetime of its use. A reliability target is set by calculating the impact of an enormous amount of variables that can come into play during the use of a product against what is feasible to accomplish while keeping manufacturing costs manageable—all the while putting out safe, stable, and predictably functional products.
We all know what happens when reliability targets are off the mark or aren’t met. Recalls occur when product failures are so egregious that the product is more likely to fail than work properly or put users at risk of injury.
The most famous examples of these are vehicles (Toyota’s unintended acceleration problem in 2009), airplanes (Boeing is still dealing with 737 MAX issues), and baby cribs. These make headlines because the effect of these defects is so harrowing.
But what about more mundane and less life-threatening failures of reliability?
For quality engineers in every manufacturing industry, the cost of failure is still very real. And for manufacturers that are moving away from mechanical fasteners in favor of adhesively bonded assemblies, how should they adjust their approach to reliability engineering to build the most dependable products possible?
How to Calculate Reliability
The most basic formula for calculating reliability is dividing the total number of failures over a given period of time by the total running time (how many cycles, miles, etc.) to get the failure rate or hazard rate.
The formula looks like this: λ = r/T
r is total failures
T is the total time
A similar formula used to figure out how long the average part should last before a failure occurs is the Mean Time Between Failure (MTBF) formula.
θ = T/r
θ is how long it takes (how many miles you put on a bike, how many openings of a door, how many years of consistent use of a cellphone) before the product begins to break down.
To get these values, quality engineers will conduct various types of analysis:
- Reliability-Centered Maintenance (RCM)
- Failure Modes and Effects (and Criticality) Analysis (FMEA, FMECA)
- Root Cause Analysis (RCA)
- Condition-based Maintenance
- Improved Work Planning Schemes
- Life Cycle Cost Strategies
- And others
For a closer look at these formulas and analysis techniques, I highly recommend reading this great primer on the basics of reliability engineering principles from Reliability Plant.
Reliability Analysis is Only as Good as the Data
The techniques listed above are great ways to try to put real numbers on how long customers can expect their purchases to last without incident. But if they don’t have quantitative analysis undergirding them, they still have a large amount of uncertainty baked in.
Everything breaks. This is just the world we live in. Entropy exists, so physical items break down, and using an item can accelerate this process.
One of the biggest challenges of reliability engineering is reducing the risk of failure that is outside the expected range. The role of Quality and Reliability Engineering is to anticipate this rate of decay under various circumstances and ensure that the final product meets these requirements with few to no instances of failure before the longevity goals.
These requirements are essentially impossible to guarantee without precise, quantitative, actionable data.
Effective RCA, FMEA, and RCM are based on reliability tests that offer data to reveal trends, point out direct sources of failures, and create predictable outcomes. Many manufacturers are wary of implementing quantitative reliability measures because they perceive them as frustratingly complex. This is not, in fact, the case, and the benefits of the operational visibility offered by objective, data-driven reliability analysis are worth making the switch to quantitative production testing.
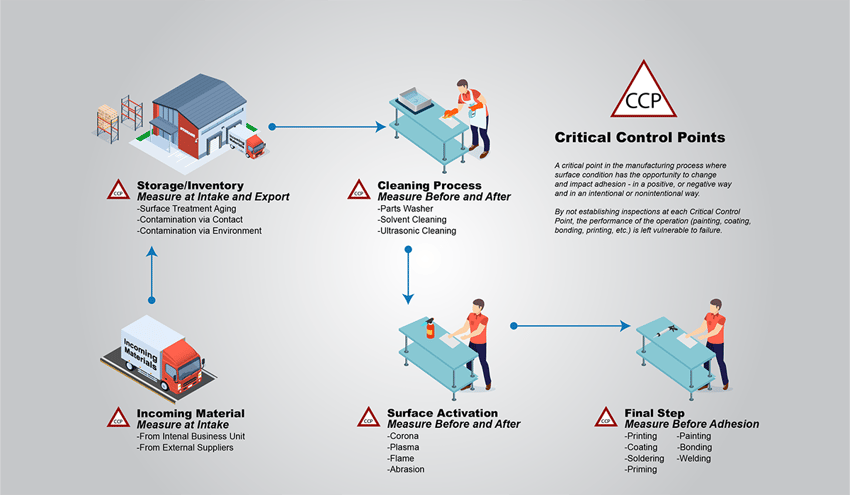
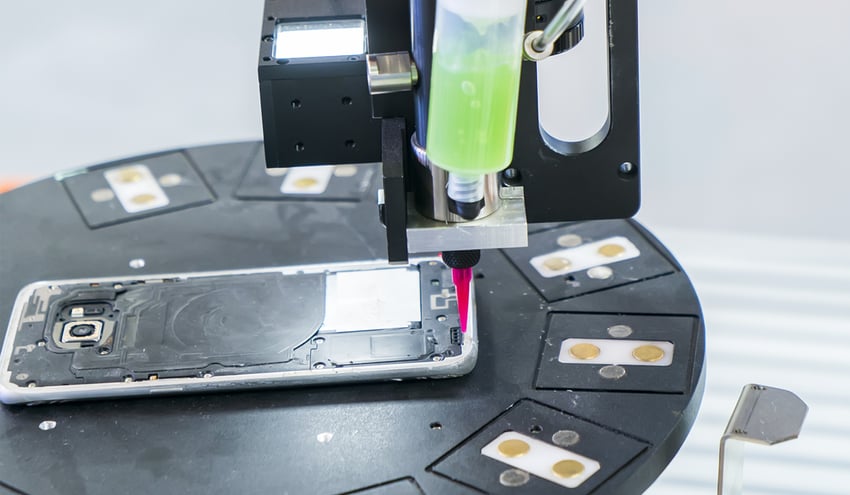
When risk can be mitigated within production processes, it only bolsters the reliability of finished products. For manufacturers whose processes involve bonding, cleaning, coating, sealing, painting, or printing, implementing data-led analysis of surface conditions throughout production is vital to getting a clear picture of how strong the adhesion between the various materials will be. Without this understanding, all attempts to calculate failure rates are massively vulnerable to error.
What Does Reliability Failure Look Like
Bikes are a great example of products that rely heavily on bonded materials to stay bonded during years of intense usage with a very quantitative value on their use - how many miles are put on them.
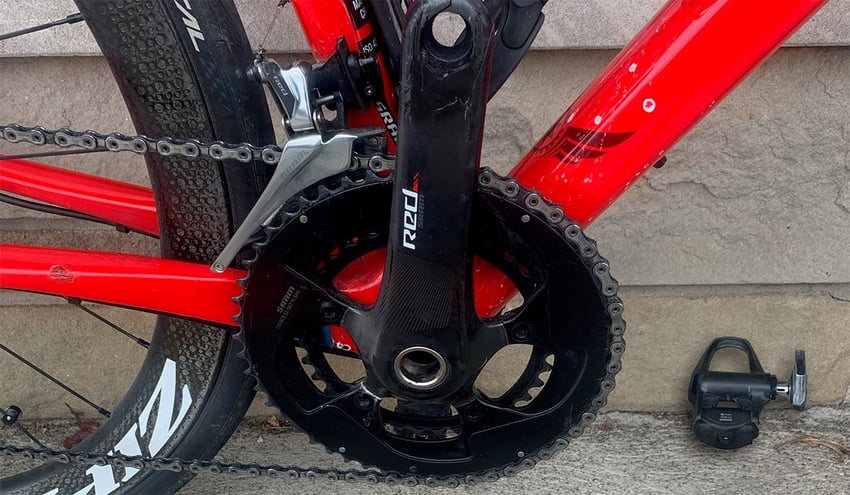
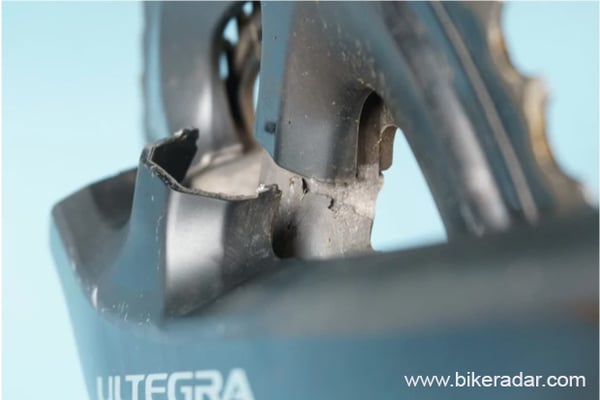
In early 2020, several users of Shimano’s Hollowtech cranksets experienced unexpected failures of the crank arms.
For non-cyclists, the crankset encompasses the pedals, the mechanism that attaches them to the bike frame, and the gear that allows them to rotate and move the chain that moves the gears that move the rear wheel.
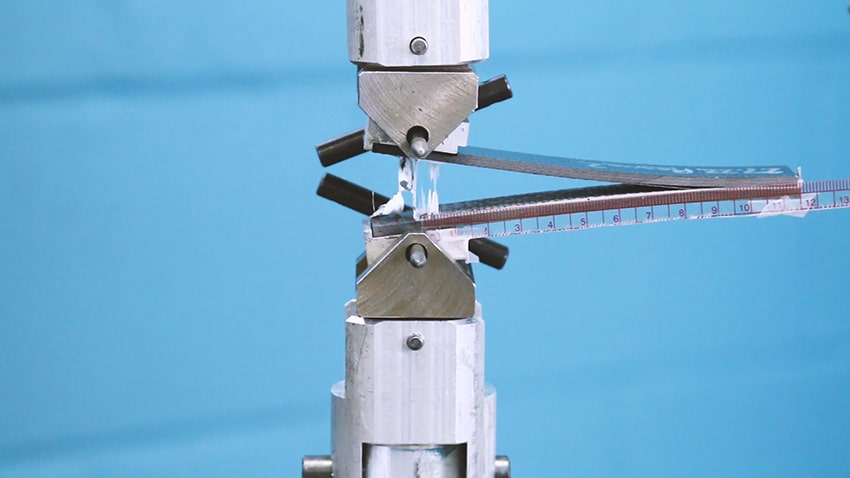
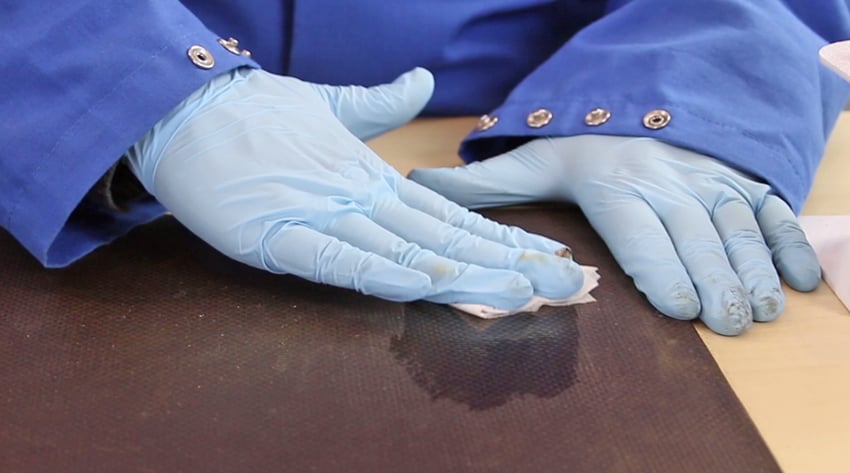
The crank arm is the (usually metal) piece that connects the pedal to the crank (gear). The cyclists experiencing these failures were noticing that one-half of the bonded aluminum alloy crank arm on one side of the crankset was pulling away from the other half of the crank arm (see photo).
This first photo is a cross-section of the crankset, showing the two interlocking pieces. Photo courtesy of Hands on Bike.
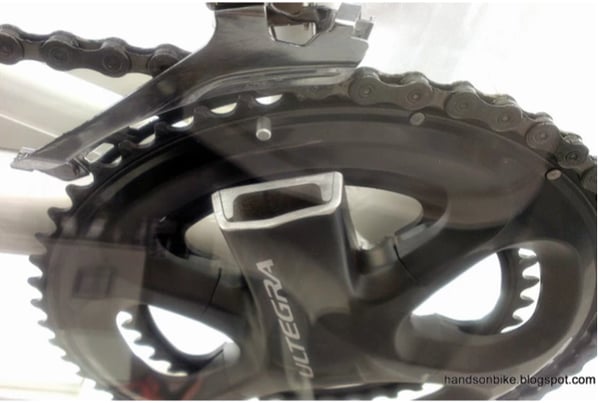
Photo courtesy of Hands on Bike.
This next image shows a crank arm failure. Notice the flakey, black substance on the inside of the arm. This is likely an adhesive used to hold the crank arm together.
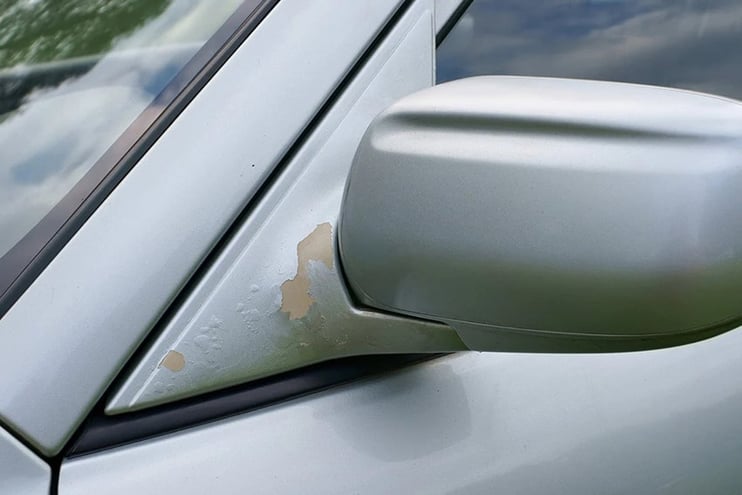
Adhesive bonds are increasingly used to build products of all sorts, especially products that are always trying to decrease their weight by using lighter-weight materials (e.g., automobiles compensating for how heavy batteries are, aircraft trying to increase fuel efficiency, etc.).
There are a couple of ways that adhesive bonding makes this lightweighting possible. Adhesive bonding cuts down the total materials involved by allowing for less material in the final assembly (no longer are hundreds or thousands of rivets and bolts needed). Adhesive bonding also allows for thinner, lighter-weight materials, such as the aluminum alloy used in these cranksets, to be utilized.
Adhesion Failure Modes: Adhesive Failure vs. Cohesive Failure
Reliability for the types of bonds used to build these cranksets means that these joints (the place where two materials are joined together with an adhesive) should predictably last over a certain amount of miles without failure. In this case, this type of bonding failure was occurring much sooner than it should have and much sooner than the vast majority of these cranksets do. All that to say, these are examples of cranksets that do not actually meet the performance requirements due to a bonding failure.
If you look back on the photo of the bond failure, you see that the adhesive is still stuck to one side but has completely detached from the other. This is called an interfacial failure. A cohesive failure means the adhesive itself broke apart, but an interfacial failure is when the adhesive can no longer hold strongly to the materials at the place of contact. These failures can occur for many reasons.
There are three primary elements that need to be controlled to ensure strong adhesion:
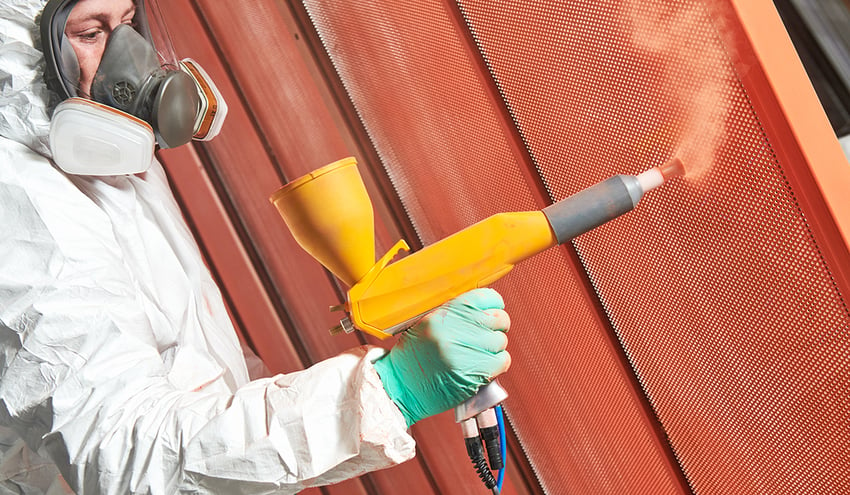
- The composition of the adhesive, coating, ink, or paint
- The application and curing of the adhesive, coating, ink, or paint
- The quality of the bond surface
The adhesive, coating, paint, and ink formulations are extremely well understood and are often created with the particular application in mind. The curing of these adhesives, coatings, etc., is also extremely well understood and controlled. What is not well understood and controlled is the surface quality.
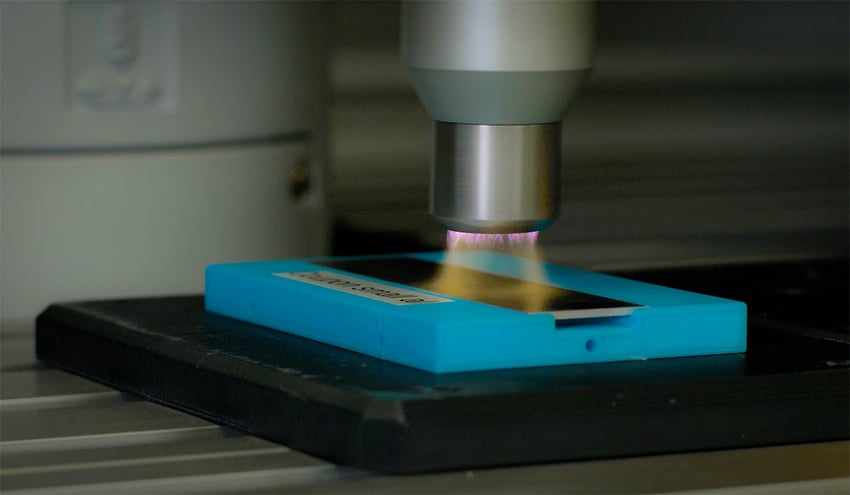
Surface quality refers to the chemical properties of the surface being controlled to the precise requirements of the bond system (the materials being bonded and the adhesive being used). These chemical properties are changed through cleaning, surface treatment, and preparation processes, and the top few molecular layers of each material are all that is needed to be controlled to ensure strong adhesion.
Dissimilar materials are being bonded more and more frequently (e.g., metals to polymers, composites to polymers, etc.), which requires very precise control over the interface between the materials.
As you can see in the photo, the adhesive is intact, so there wasn’t a failure of the adhesive or the curing, but there was likely a molecular-level contaminant on the surface of the metal the adhesive was applied to, resulting in a weak bond. Over time and usage, the weak bond began to fail, and since bikes are used outdoors and are exposed to lots of moisture and dirt that can cause corrosion and further weaken bonds, they were able to sneak into the joint and cause what ended up being a catastrophic failure.
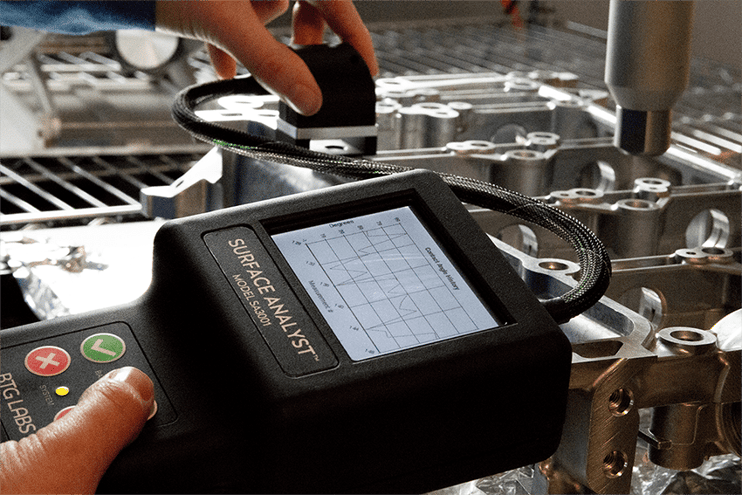
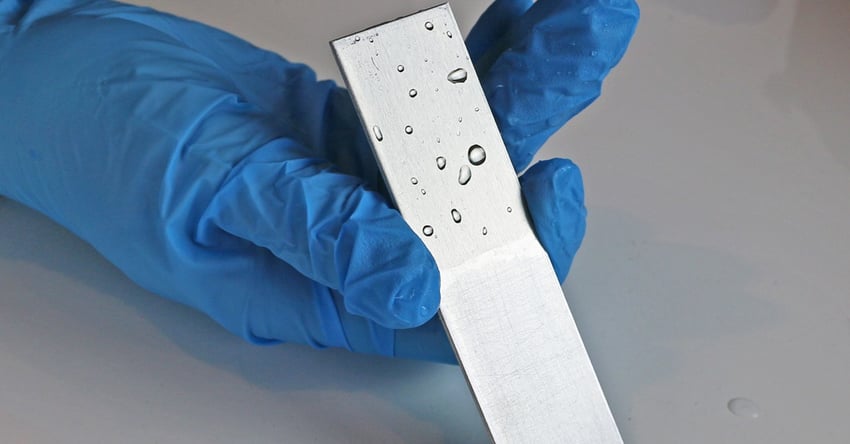
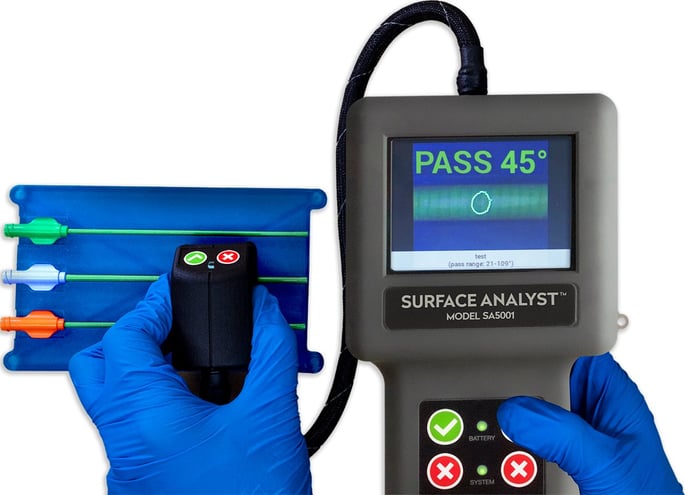
How to Ensure Reliability Using Simple Contact Angle Measurements
The best way to get a quantitative value that is predictive of adhesion failures like this is to use a fast, simple contact angle measurement. Contact angles are sensitive to changes in a material's top few molecular layers. They can be rapidly deployed to ensure high-volume manufacturing can run at ambitious rates.
Quality and reliability management must involve quantitative evaluation of all surface cleaning, treatment, and preparation processes.
Without the objective data offered from contact angle measurements, the reliability of these bonds is left up to chance without any quantitative way of predicting how long the bonds will last. Contact angle measurements put a numerical value on the surface quality that is accurate and reproducible, and the contact angle changes consistently with how clean the surface is - giving manufacturers a clear picture of how prepared the surfaces are for bonding.
To reduce the risk of recalls and trackably decrease warranty claims, rework, and downtime spent troubleshooting issues, in-line surface quality controls are manufacturers’ best bet at not having to rely on luck to see progress in these areas.
To learn more about implementing a reliability engineering program that leaves no variables unexamined and quantified, download our eBook: The Future of Manufacturing: A Guide to Intelligent Adhesive Bonding Technologies & Methodologies.


.jpg?width=850&height=495&name=metal-brazing-copper-component%20(reduced).jpg)